
It is the development growth curve evaluated by months. It is a chart that shows whether the development of babies is progressing normally. In general, percentile values between P25 and P75 are considered normal.
If your child's values (the 50th percentile) are very close to the P50 values, this means that out of 100 normal children, 50 will have values greater than him and 50 will have values lower than him.
Similarly (75th percentile) if P75 values, it means that children the same age as your child are greater than 75 children and less than 25, compared to 100 children.
Today, the average percentile values are as follows.
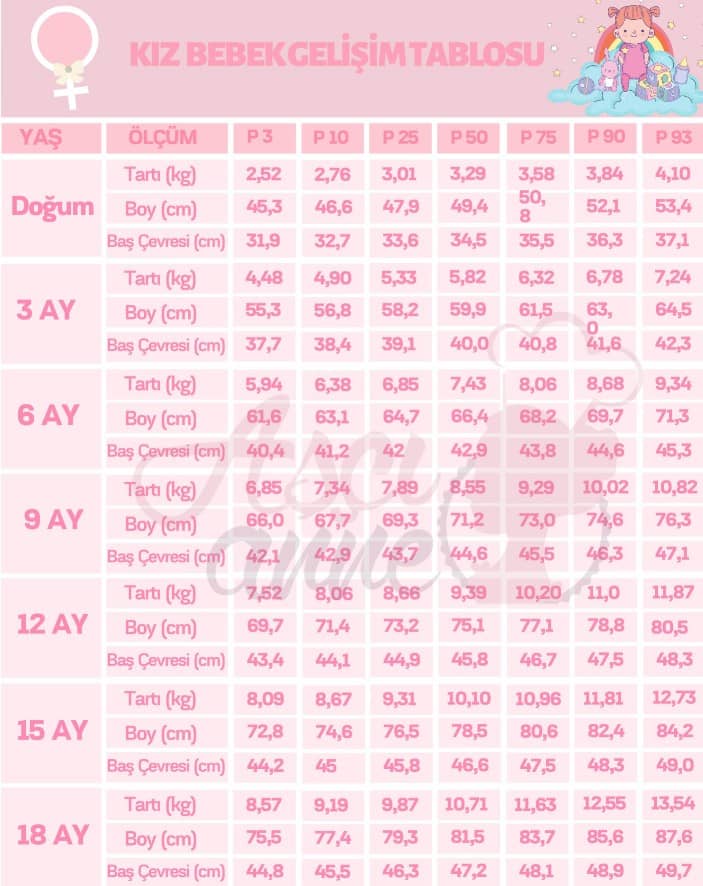
The charts are different for boys and girls. That's because male babies tend to be larger and grow faster than female babies.
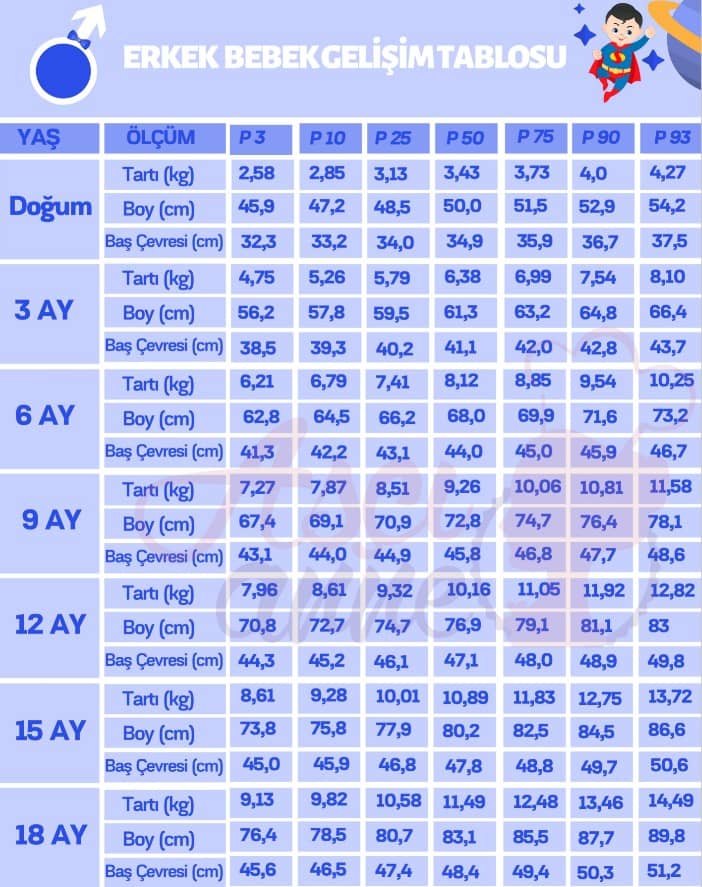
If a child's growth rate is above the 90th percentile, it is usually considered overgrowth , and below the 50th percentile, it is considered undergrowth . But we shouldn't be too worried about this. For a healthy information, we should consult our doctor about the subject.
How to Calculate Gender with the Chinese Calendar? You can also check out our blog post.